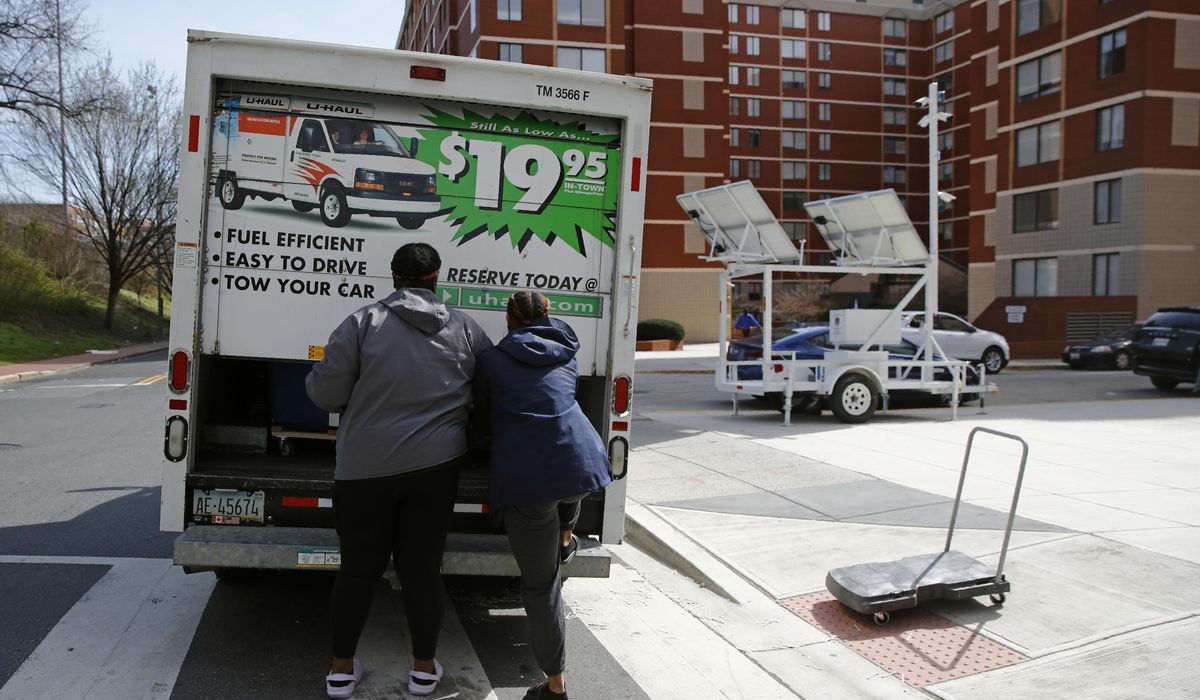
Contrary to popular belief, there has been no great migration in the U.S. during the pandemic.
New figures released Wednesday by the U.S. Census Bureau show that the proportion of people who moved over the past year fell to its lowest level in the 73 years that it has been tracked, in contradiction to popular anecdotes that people left cities en masse to escape COVID-19 restrictions or in search of more bucolic lifestyles.
In 2021, more than 27 million people, or 8.4% of U.S. residents, reported having moved in the past year, according to the Current Population Survey Annual Social and Economic Supplement.
By comparison, 9.3% of U.S. residents moved from 2019 to 2020. Three decades ago, that figure was 17%.
Besides giving rise to shelter-in-place restrictions, the COVID-19 pandemic may have forced people to postpone life-cycle events such as marriages or having babies that often lead to moves. But the decline is part of a decadeslong migration decline in the U.S., said William Frey, a senior fellow at The Brookings Institution.
“These numbers show a lot of people didn’t move or moved at a slower rate,” Frey said. “But it’s a longer-term trend.”
That’s not to say that nobody moved. The one uptick in mobility patterns last year took place in longer-distance moves, from state to state, compared to moves within a state or county. Those 4.3 million residents who moved to another state may have done so because of the pandemic, Frey said.
Other factors contributing to Americans staying put have been an aging population, since older people are less likely to move than younger ones; the ability to telecommute for work, which allowed some workers to change jobs without having to move; and rising home prices and rents that kept some would-be movers in place, demographers said.
“I think the boom in remote work because of COVID coupled with the economic shock is the big reason,” said Mary Craigle, bureau chief for Montana’s Research and Information Services.
Among those who moved in the past year, a little under half cited housing-related factors as the reason, almost three times those citing job-related reasons and almost double family-related reasons. Of the 12.3 million people citing housing reasons, more than a third wanted a bigger, better or newer house or apartment, according to the survey.
Those with a bachelor’s degree or graduate degree had higher mobility rates than those with no high school degree or only a high school education.
Among regions, the South had the largest net migration, 576,000 new residents, while the Northeast lost the most – 146 million people. There were flows of people moving from rural areas into metro areas, as well as people moving from principal cities to suburbs in the same metro areas, though not in numbers that varied from past years.
Mobility in the U.S. has been on a downward slide since 1985 when 20% of U.S. residents moved. That was an era when Baby Boomers were young adults, beginning careers, getting married and starting families. In comparison, millennials, who today are in the same age range as their Baby Boomer cohorts were in the mid-1980s, are stuck in place due to high housing costs and underemployment, according to an analysis Frey did last year.
The slowdown in American mobility is part of a recent stagnation in population dynamics in the U.S. The 2020 census shows that the U.S. grew by only 7.4% over the previous decade, the slowest rate since between 1930 and 1940. Earlier this week, the Census Bureau revealed that the population center of the U.S. moved only 11.8 miles (19 kilometers), the smallest shift in 100 years.
Health, The New York Today
